Rocket Tracking
While I was still procrastinating doing the altosui and Google Earth mashup I mentioned last post, Keith pointed out that Google Maps has a static API, which means it’s theoretically possible to have altosui download maps of the launch site before you leave, then draw on top of them to show where your rocket’s been.
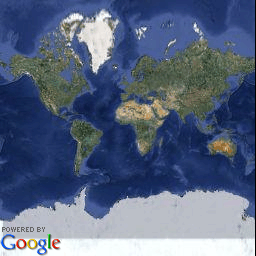
The basic API is pretty simple — you get an image back centred on a given latitude and longitude; you get to specify the image size (up to 640×640 pixels), and a zoom level. A zoom level of 0 gives you the entire globe in a 256×256 square, and each time you increase the zoom level you turn each pixel into four new ones. Useful zoom levels seem to be about 15 or so. But since it’s a Mercator projection, you don’t have to zoom in as far near the poles as you do around the equator — which means the “or so” is important, and varies depending on the the latitude.
Pulling out the formula for the projection turns out to be straightforward — though as far as I can tell, it’s not actually documented. Maybe people who do geography stuff don’t need docs to work out how to convert between lat/long and pixel coordinates, but I’m not that clever. Doing a web search didn’t seem to offer much certainty either; but decoding the javascript source turned out to not be too hard. Formulas turn out to be (in Java):
Point2D.Double latlng2coord(double lat, double lng, int zoom) {
    double scale_x = 256/360.0 * Math.pow(2, zoom);
    double scale_y = 256/(2.0*Math.PI) * Math.pow(2, zoom);
    Point2D.Double res = new Point2D.Double();

    res.x = lng*scale_x;
    double e = Math.sin(Math.toRadians(lat));
    e = limit(e, -1+1.0E-15, 1-1.0E-15);
    res.y = 0.5*Math.log((1+e)/(1-e))*-scale_y;
    return res;
}
That gives you an absolute coordinate relative to the prime meridian at the equator, so by the time you get to zoom level 15, you’ve got an 8 million pixel by 8 million pixel coordinate system, and you’re only ever looking at a 640×640 block of that at a time. Fortunately, you also know the lat/long of the center pixel of whatever tile you’re looking at — it’s whatever you specified when you requested it.
The inverse function of the above gives you the the latitude and longitude for centrepoints of adjacent maps, which then lets you tile the images to display a larger map, and choosing a consistent formula for the tiling lets you download the right map tiles to cover an area before you leave, without having to align the map tiles exactly against your launch site coordinates.
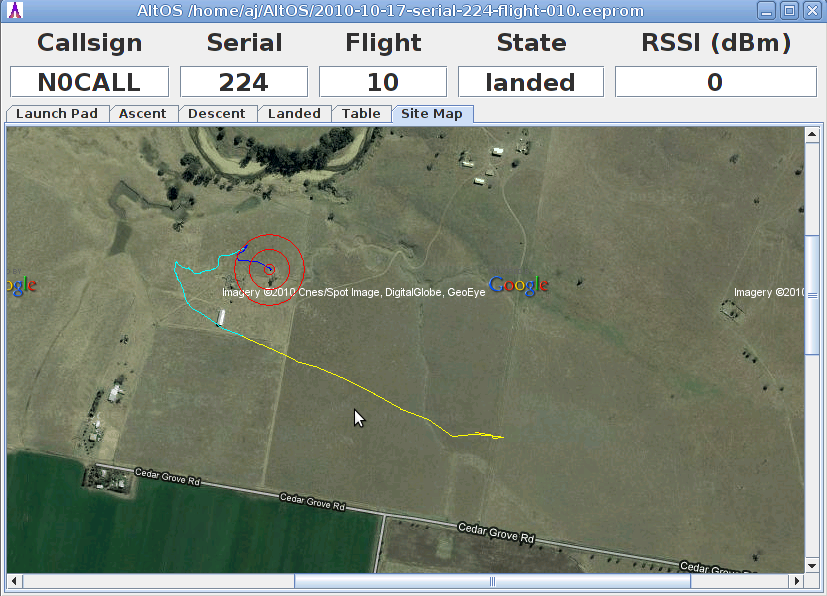
In Java, the easy way to deal with that seems to be to setup a JScrollable area, containing a GridBagLayout of the tiles, each of which are images set as the icon of JLabels. Using the Graphics2D API lets you draw lines and circles and similar on the images, and voila, you have a trace:
Currently the “UI” for downloading the map images is that it’ll print out some wget lines on stdout, and if you run them, next time you run altosui for that location, you’ll get maps. (And in the meantime, you’ll just get a black background)

